peoples-api-demos
NYC Housing Policy Analysis for Mayor Mamdani
Date: March 24, 2026
Scope: Comprehensive data-driven housing policy analysis spanning supply, affordability, subsidized housing, building conditions, public land, and NYCHA capital needs across all five NYC boroughs.
-
Primary Deliverable:
Mamdani_Policy_Analysis_EXPANDED.md
a ~2,600-line policy brief with six analytical sections, evidence-based findings, risk scenarios, and implementation roadmaps. -
Supplementary Deliverables:
Housing Policy Master Dashboard
8 interactive dashboards in HTML format, detailed data source ontology, and methodological notes.
What This Is - An AI-accelerated Policy Analysis Workbench
This project demonstrates an AI-driven policy analysis workflow built incrementally with Claude Cowork and the qsv data wrangling plugin and its Policy-Analyst Agent. Starting from raw public datasets, it produces a 2,600-line policy analysis document and 8 interactive dashboards — all generated through iterative conversation with Claude.
The scenario is drafting a housing policy briefing for Mayor Zohran Mamdani, pre-loading all the data in a Cowork Project, with the initial prompt:
“Can you analyze the NYC 311 files, the PLUTO file, the Furman Center Subsidized Housing Database (see https://www.furmancenter.org/data-tools-resources/data-tools-data-downloads/ for info), NYC’s Budget for FY 2025 (see https://www.nyc.gov/content/omb/pages/publications to retrieve files as needed), and do a comprehensive temporal analysis using the policy-analyst agent through the lens of Mayor Mamdani’s priorities?”
Note that we didn’t specify the exact policy questions or analysis sections upfront. After the Agent derived the initial ontology based on the intentionally Housing-centric starter datasets, we let the data exploration and analysis be driven by the findings and patterns discovered by the Policy Analyst Agent - as it repeatedly consulted with us in the process based on its understanding of Mayor Mamdani’s priorities which it researched from public sources.
This allowed us to minimize any bias or constraints we might have introduced by pre-defining the analysis structure, and instead let the data and the agent’s reasoning drive the insights - as we proactively steered it to explore relevant areas and skip irrelevant ones - as what would happen in a real-world scenario where the policy questions evolve as you explore the data and discover new patterns.
After the initial analysis was drafted, Claude made additional recommendations for further analysis, and we onboarded additional datasets - StreetEasy market data, Census ACS estimates, BLS economic indicators, and NYCHA Physical Needs Assessments.
The first session started on March 23, 2026 at 7:54 AM EST and last session ended on 2026-03-24 at 9:58 AM EST, with about ~8 hours of active conversation and analysis time over ~10 sessions, with the qsv MCP Server being invoked 273 times. The final deliverables were produced by the end of the last session, with some additional time for formatting and documentation.
Deliverables
Primary Analysis
Mamdani_Policy_Analysis_EXPANDED.md (176 KB, ~2,600 lines)
The main deliverable — a comprehensive policy brief covering six analytical sections with data from 8 sources:
- Section A: Supply Pipeline — Permit trends, production gap analysis, borough-level completions (DCP HousingDB)
- Section B: Affordability Crisis — Rent burden, income-rent divergence, bedroom-level analysis (StreetEasy, Census ACS, BLS)
- Section C: Subsidized Housing & 421-a — Subsidy portfolio risk, 421-a bimodal expiration timeline for 211,567 units (Furman Center)
- Section D: Housing Conditions — 9.83M HPD complaints over 16 years, seasonal patterns, borough disparities (311)
- Section E: Public Land Inventory — 6,632 developable city-owned parcels, 453,910 potential units by unused FAR (PLUTO)
- NYCHA Capital Backlog — $61.6B five-year / $78.6B twenty-year capital needs, system-by-system breakdown, 2023→2025 trend (NYCHA PNA)
Also includes: policy findings with evidence ratings, risk scenarios, implementation roadmaps, and full methodological notes with a confidence assessment table.
Interactive Dashboards
All dashboards are self-contained HTML files using Chart.js 4.4.1. No server required — open in any browser. Each has borough and time/view filters, dark theme, and links back to the Master Dashboard.
| File | Description | Size |
|---|---|---|
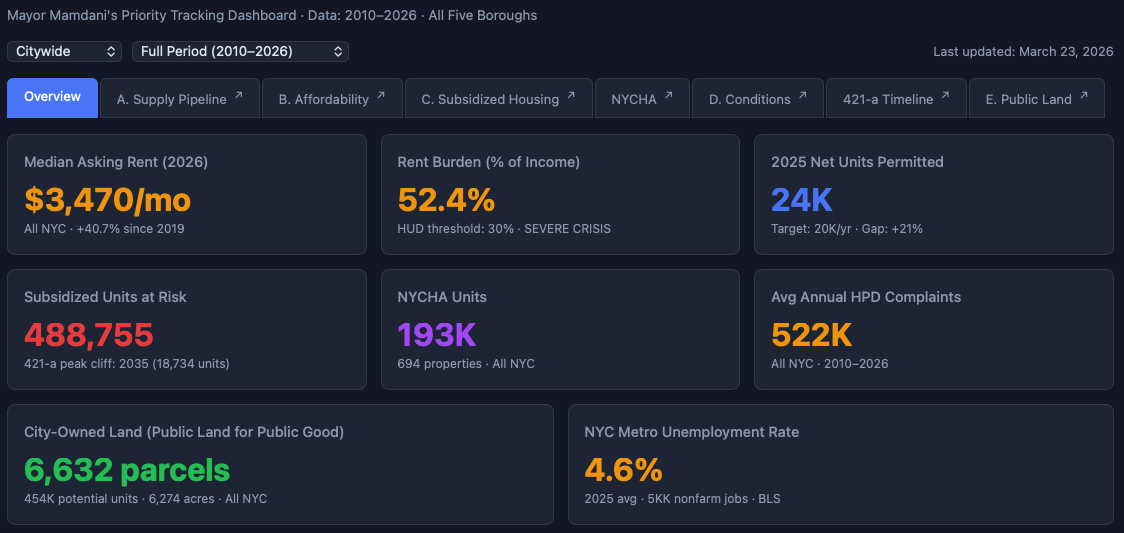
Explorer_Master_Dashboard.html |
7-tab hub linking all sections. Overview KPIs, borough filter, time period filter. | 114 KB |
Explorer_A_Supply_Pipeline.html |
Permit trends, completions lag, borough production comparison (2010–2026) | 60 KB |
Explorer_B_Affordability.html |
Rent trends by bedroom, income-rent gap, rent burden, StreetEasy + Census + BLS | 63 KB |
Explorer_C_Subsidized_Housing.html |
Subsidy portfolio by program, expiration risk, borough exposure | 32 KB |
Explorer_D_Conditions.html |
311 HPD complaint volume, seasonal patterns, complaint types, borough trends | 32 KB |
Explorer_421a_Timeline.html |
421-a expiration timeline 2026–2060, bimodal wave visualization, borough deep dive | 22 KB |
Explorer_E_Public_Land.html |
City-owned developable parcels, potential units, flood zone cross-reference | 25 KB |
Explorer_NYCHA_Capital.html |
PNA 2023 vs 2025 comparison, work type breakdown, top developments, cost distribution | 32 KB |
Data Sources
| Source | Description | Coverage |
|---|---|---|
| Furman Center SHD | Subsidized Housing Database — BBL-level property records with subsidy programs, expiration dates, REAC scores, violations | 5,261 properties, May 2025 |
| NYC PLUTO | Primary Land Use Tax Lot Output — tax lot characteristics, zoning, ownership, building area | 858,284 lots, Feb 2026 |
| StreetEasy | Market data — median rent, sales prices, inventory, days on market, price indices | Borough-level, 2010–2026 |
| NYC 311 | Service requests filtered to HPD housing complaints | 42.96M total / 9.83M HPD, 2010–2025 |
| Census ACS | via Official US Census MCP Server - American Community Survey 1-Year Estimates — income, rent, burden, tenure, poverty | 5 boroughs, 2010–2023 |
| BLS | Bureau of Labor Statistics via BLS MCP Server — CPI, shelter inflation, unemployment, wages | NYC metro, 2010–2026 |
| NYCHA PNA | Physical Needs Assessment development-level results | 233 developments, 2023 & 2025 |
| DCP HousingDB | NYC housing permit and completion database | Post-2010 permits |
Key Findings
- Housing production falls 29% short of the 20,000 units/year target (17,669 permitted in 2025)
- Rents up 45–90% since 2010 depending on borough; Bronx worst at 89.9% growth with 75.9% rent burden
- 211,567 units face 421-a expiration in two waves: 2026–2035 (99,051 units) and 2052–2059 (61,088 units); 93.8% of portfolio already tax-delinquent
- $61.6B NYCHA capital backlog accelerating — per-unit costs surged 8.0% in two years despite 31 developments leaving for PACT/RAD
- 9.83M HPD complaints over 16 years, hitting record 774,437 in 2025 (+66% vs 2019); heat/hot water dominates at 40.8%
- 6,632 developable city-owned parcels with 453,910 potential housing units by unused FAR; Bronx has lowest flood risk (14%), making it the priority target
How This Was Built
This entire analysis was produced through conversational interaction with Claude Cowork, using the qsv 18.0.4 Cowork plugin, primarily using its Policy-Analyst Agent. All data processing, analysis, and visualization steps were driven by iterative conversations with Claude, with the qsv Cowork Plugin skills and commands steering all data ingestion, profiling, and SQL querying tasks using the qsv MCP Server.
The workflow:
- Data ingestion — Raw datasets loaded and profiled using qsv tools (stats, frequency, headers), compiled into an PROJECT_ONTOLOGY.md (initial & final) of data sources, key fields, and quality notes for reference throughout the analysis
- Data wrangling — SQL queries via qsv’s Polars engine with DuckDB passthrough/fallback, Python extraction for complex transforms (comma-formatted numbers, date parsing, UTF-8 encoding issues)
- Analysis — Iterative exploration driven by findings (e.g., discovering the bimodal 421-a expiration pattern, the PLUTO park-filtering challenge, Manhattan’s FAR density anomaly)
- Documentation — Policy analysis written section-by-section with real data tables, updated as new datasets were integrated
- Visualization — Interactive Chart.js dashboards with borough/time filters, built to match a consistent dark-theme design system
- Audit — Cross-file consistency checks, data validation, confidence ratings
Each analytical section went through several cycles of: explore data → discover patterns → document findings → build dashboard → integrate into master document → audit for consistency.
Repo Structure (Published Files)
README.md                              ← This file
Mamdani_Policy_Analysis.md             ← Initial draft of the policy analysis (~600 lines)
Mamdani_Policy_Analysis_EXPANDED.md    ← Expanded analysis document (~2,600 lines)
Explorer_Master_Dashboard.html         ← Master dashboard (7 tabs)
Explorer_A_Supply_Pipeline.html        ← Supply pipeline dashboard
Explorer_B_Affordability.html          ← Affordability dashboard
Explorer_C_Subsidized_Housing.html     ← Subsidized housing dashboard
Explorer_D_Conditions.html             ← Housing conditions dashboard
Explorer_421a_Timeline.html            ← 421-a expiration timeline
Explorer_E_Public_Land.html            ← Public land inventory
Explorer_NYCHA_Capital.html            ← NYCHA capital backlog
PROJECT_ONTOLOGY-initial.md            ← Initial data source ontology with key fields and quality notes
PROJECT_ONTOLOGY-final.md              ← Final data source ontology with updates after full data exploration
qsvmcp.log                             ← Log of all qsv MCP Server interactions (273 invocations)
Raw data files (CSVs, PLUTO, 311, PNA Excel files) are not included in this repo due to size (~35 GB total). See Data Sources above for where to obtain them. During the analysis, Claude and qsv produced 133 intermediate analysis artifacts, including SQL query logs, Python scripts, data profiling outputs, and iterative policy analysis drafts. These are not included in the published repo but can be made available upon request for audit purposes.
Conclusion
This experiment demonstrates the potential of AI-driven policy analysis workflows to rapidly synthesize complex datasets into actionable insights and recommendations.
We minimized hallucinations by scaffolding an iterative analysis cycle that started by inferring a project ontology - followed by repeated exploration, validation, auditing and refinement with the Policy Analyst Agent. This was further facilitated by qsv, as it’s exponentially faster than traditional data wrangling tools, minimizing iteration cycle times. This allowed us to “steer” the analysis and produce a comprehensive housing policy analysis in just a few hours.
This approach mimics how AI-assisted Software Development has advanced rapidly in recent months with iterative test-driven development pioneered by Claude Code - as the rapid feedback loop enables both the Model and the Developer to make quick course corrections.
We also leveraged the torrid pace of Claude development. Just this year alone:
- Jan 16: The introduction of Claude Cowork - bringing the same collaborative, iterative approach pioneered by Claude Code to knowledge work.
- Feb 5: Opus 4.6’s improved reasoning and contextual understanding enabled deeper analysis and synthesis across multiple complex datasets.
- Feb 24: The introduction of Cowork Plugins enabled us to bundle Agents, Skills and Commands into a single package (big props to Anthropic for open-sourcing their Cowork Plugin implementations, from which we “took” a lot of inspiration 😉).
- Mar 13: The 1M context window (from 200k tokens) for both Opus 4.6 and Sonnet 4.6 allowed us to avoid context rot and work across multiple datasets and analysis sections.
- Mar 20: The release of Cowork Projects allowed us to pre-load all datasets and analysis artifacts into a single collaborative workspace, with its own memory and CLAUDE.md file, allowing us to maintain persistent context across different sessions.
No work is without its limitations. In a real-world scenario, we would recommend a more extended timeline with multiple rounds of human expert review and stakeholder engagement to validate findings and refine recommendations before informing policy decisions.
Still, we’re amazed at how far we got in just a few hours and the quality of the analysis produced. And having built numerous Dashboard products and solutions in the past, we’re particularly impressed by how we can create interactive, bespoke ad-hoc reports without dealing with the one-size-fits-all constraints of traditional BI/SaaS solutions - which could have easily taken weeks if not months to build or customize with a data engineering team, and that’s after creating ETL pipelines to onboard the data into proprietary databases. With this approach, we can go from raw data to actionable insights in hours, and easily update the analysis as new data comes in or priorities shift.
In our opinion, this is a game-changer for the public sector, which often do not have the luxury of extensive data engineering resources. With AI-driven workflows like this, we can democratize access to powerful data analysis and enable more responsive, evidence-based policymaking.
And we believe this is just the beginning. Currently, the main bottleneck is the repeated in-situ FAIRification and manual onboarding of datasets into the analysis workflow. The Project Ontology we compile at the beginning of the process was critical for keeping track of the datasets, their key fields, and quality notes - but it was not a formal ontology and we have to derive it with Claude’s general world knowledge. What if we had a standardized, machine-readable, agent-understandable, user-friendly data source ontology format (“Open Data as a Verb”) that could be automatically extracted from datasets and ingested into the analysis workflow?
Cue CKAN integration. 😊
This would allow us to onboard and discover new and related datasets in seconds instead of hours, and maintain a live data catalog not just for this project but across the entire organization, if not the entire civic data ecosystem!
IMHO, once we do, we can say we have achieved “Accelerated Civic Intelligence.” 😉
AI Disclaimer
This analysis was produced using Claude, an AI assistant by Anthropic, using datHere’s qsv Cowork plugin. All data processing is systematic and reproducible, but policy recommendations reflect analysis of provided datasets and should be validated against additional sources and stakeholder input before use in policy decisions.
Github Repo: https://github.com/dathere/peoples-api-demos/
Github Pages: https://dathere.github.io/peoples-api-demos/NYC-Housing-Policy-SOD2026/
LinkedIn post: https://www.linkedin.com/posts/joelnatividad_nyc-housing-policy-analysis-for-mayor-mamdani-activity-7442299861846163456-XwMB